- Incorta Community
- Knowledge
- Administration Knowledgebase
- Installing the New Incorta Metadata Suite Tools fo...
- Subscribe to RSS Feed
- Mark as New
- Mark as Read
- Bookmark
- Subscribe
- Printer Friendly Page
- Report Inappropriate Content
- Article History
- Subscribe to RSS Feed
- Mark as New
- Mark as Read
- Bookmark
- Subscribe
- Printer Friendly Page
- Report Inappropriate Content
on
02-23-2024
07:28 AM
- edited on
03-06-2024
11:18 AM
by
![]() Tristan
Tristan
What’s New
The new Observability tool provides an easy and intuitive way to monitor and report Loader and Analytics services exceptions and performance metrics and help pinpoint the root causes of issues and their impact on the end-user experience. It includes new dashboards that provide insights on recent load job failures, interruptions, errors, and performance-related issues.
|
Dashboard Name |
Description |
| 1. Dashboard - User Analytics (BI Audit) | User engagement and dashboard analytics. This dashboard is driven from the audit table. |
| 2. Data Load Summary (New) | Analysis of schema/table jobs (extracts/loads) historically, daily performance, and error details |
| 2. Data Load Summary - Load Plan (New)* | Analysis of load plans/schema/table jobs (extracts/loads) historically, daily performance, and error details |
| 3. Metadata Exceptions (Updated) | Analyze metadata issues, such as warnings, errors, etc. |
| 4. Unused Entities | Analyze unused physical schema tables/columns |
| 5. Data Lineage | Dashboard to business schema to physical schema linking |
| 6. SQL Query-User Analytics (BI SQLi_Audit) | SQLi usage summary/trends/query details |
| 7. Security (Users-Groups-Roles) | Overview of Users/Groups/Roles. |
| 8. Health Check | Schema load health check - Errors/Performance |
* "2. Data Load Summary - Load Plan" dashboard can be used only with load plan supported on-premise versions.
Assumptions
- Confirm the version of your Incorta installation. These attachments and instructions are exclusively for version 6.0 and higher. The load plan-related content is supported by version 2023.7.x+
- These instructions also assume that you use MySQL as the Incorta metadata database. If you are using Derby or Oracle for your metadata database, please consult with your Incorta customer success team first.
- These instructions assume you already have a data source connection to connect to the Incorta metadata database running on MySQL. The assets below assume this data source connection is called "_incortametadata". If you do not have one called "_incortametadata", please create one. Alternatively, you can contact the customer success team if you do not have the permission or information to create a new “_incortametadata " data source.
- Within the dashboards, any timestamps displayed (e.g., schema load timestamps) will be on server time, which may offset local browser time. It can be offset by a certain number of hours. When you match dashboard timestamps with the time indicated in the UI under Schema Job Details, you must consider this possible time zone difference.
- If you have deployed previous versions of the "Audit" schema or "_incortametadata" schema, this install subsumes and supersedes those. Please contact the customer success team if you have modified these schemas and want to merge them with the new content.
Pre-requisites
- Metadata database source connection
- Verify that the metadata connection name is “_incortametadata”
- Verify that the metadata connection name is “_incortametadata”
- Upload the following files to the tenant data directory.
- Date_US.csv
- Month_US.c
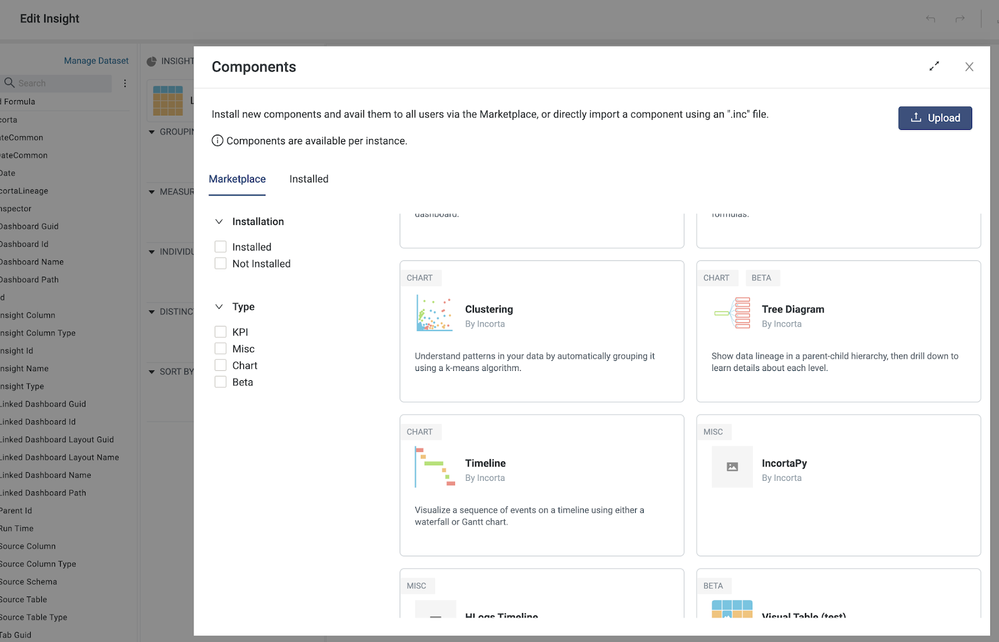
- Install the “Timeline” visual from the marketplace.
- Set up Inspector Schedules in the CMC portal
Here are the steps to create an Inspector job:
- As the CMC Administrator, sign into the CMC.
- In the Navigation bar, select Scheduler.
- In the Inspector tab, in Cluster Name, select a cluster.
- In the List view, in the Action Menu, select +.
- In the Add a new job dialog, specify the following
- Name
- Tenant
- Specify the schedule expression as follows:
- Numeric frequency, time intervals, and recurrence
- Starting in terms of a set time and GMT
- Start Date, optional End Date, and Does Not End selection.
- Select Add job.

Deployment Steps
The steps below will help you get Incorta's Metadata Analytics up and running in your environment in no time. These steps will help you set up a pre-built schema, business schema, and dashboards.
- Download the file Observability.zip file
- Unarchive the zip file
- The folder contains three zip files
- schemas.zip
- business_schemas.zip
- dashboards.zip
- Import the schemas.zip
- Import the business_schemas.zip
- Import the dashboards.zip
- Execute the Inspector scheduler in CMC (schedule or ad-hoc)
- Load the “_DateCommon” schema
- Load the “_IncortaMetadata” schema
- Load the “_InspectorMetadata” schema
- Do a quick sanity test of the deployed code by verifying the dashboards
- Set up schema load schedules suitably
Data App Download
Please contact our support team to get the required zip file for deployment purposes.- Mark as Read
- Mark as New
- Bookmark
- Permalink
- Report Inappropriate Content
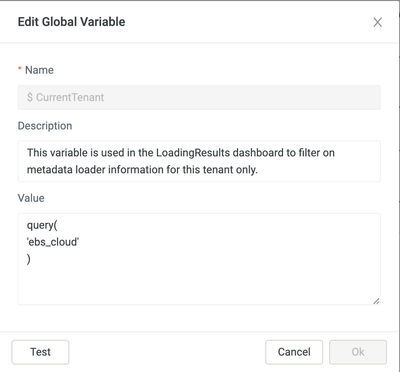
Pls. create/update the global variable "CurrentTenant" with suitable value. e.g. “ebs_cloud” is the tenant name in the following screenshot.


