- Incorta Community
- Discussions
- Dashboards & Analytics Discussions
- Re: Distinct of 2 columns
- Subscribe to RSS Feed
- Mark Topic as New
- Mark Topic as Read
- Float this Topic for Current User
- Bookmark
- Subscribe
- Mute
- Printer Friendly Page
- Mark as New
- Bookmark
- Subscribe
- Mute
- Subscribe to RSS Feed
- Permalink
- Report Inappropriate Content
04-23-2023 11:54 PM
Can we create a column which calculates distinct of 2 same columns but with different filter?
Consider Column_1 is having a filter Filter_1 and Column_2 is having a filter Filter_2, here both the columns are same but filters are different. Also filters are coming from Presentation Variables.
I've tried to create one but distinct function requires second parameter as Group By.
Solved! Go to Solution.
- Mark as New
- Bookmark
- Subscribe
- Mute
- Subscribe to RSS Feed
- Permalink
- Report Inappropriate Content
04-24-2023 05:57 AM - edited 04-24-2023 06:30 AM
Hi,
Using formula Builder and presentation variables ->
Using the distinct function on a case condition considering the presentation variables and grouping by the region
(P.S it is +1 because it considers the else condition as well ("NULL"))
- Mark as New
- Bookmark
- Subscribe
- Mute
- Subscribe to RSS Feed
- Permalink
- Report Inappropriate Content
04-24-2023 06:56 AM
Hi @Wadeyy03 ,
Thank you for the reply, I've tried to implement both the approaches but there is slight data variation between 2 approaches.
Is it due to formula builder or any other reason??
- Mark as New
- Bookmark
- Subscribe
- Mute
- Subscribe to RSS Feed
- Permalink
- Report Inappropriate Content
04-24-2023 11:12 PM
Hi Spd_03,
It might be because of my data but maybe it is considering the "NULL" as well somewhere.
- Mark as New
- Bookmark
- Subscribe
- Mute
- Subscribe to RSS Feed
- Permalink
- Report Inappropriate Content
04-24-2023 10:31 AM
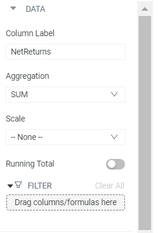
Alternate: In an insight drag the column to the measures area - twice. Open the measure property and drag a formula to the "filter" target:
It's a nice feature. Note: I think you'll find it's only available for aggregated measures. If it needs to be repeatable ( e.g. "Sales for California" ) make it a formula column in the schema. You'll wind up w/ a bunch of formula columns, but runtime performance will be better.
- How to Disable Timezone Conversion for Date/Datetime Columns in Incorta? in Data & Schema Discussions
- Session Variable forCurrent and Past two years in Data & Schema Discussions
- Rename column name in Business view in Data & Schema Discussions
- Alternative to Level-Based Formula in Aggregate Insight (Without Using MV) in Dashboards & Analytics Discussions
- Unable to save the mv for creating a table from using a json keys in Data & Schema Discussions


