This website uses Cookies. Click Accept to agree to our website's cookie use as described in our Privacy Policy. Click Preferences to customize your cookie settings.
Turn on suggestions
Auto-suggest helps you quickly narrow down your search results by suggesting possible matches as you type.
Showing results for
- Incorta Community
- Knowledge
- Administration Knowledgebase
- Cloud Console Overview
Options
- Subscribe to RSS Feed
- Mark as New
- Mark as Read
- Bookmark
- Subscribe
- Printer Friendly Page
- Report Inappropriate Content
DilrajS
-modified.png?version=preview)
Employee Alumni
Options
- Article History
- Subscribe to RSS Feed
- Mark as New
- Mark as Read
- Bookmark
- Subscribe
- Printer Friendly Page
- Report Inappropriate Content
on 09-28-2022 08:12 AM
Introduction:
Let’s use this article to familiarize ourselves with the Incorta cloud console. The cloud console can be used to navigate to the cloud cluster, CMC (cloud management console), and the spark engine. Mainly, the cloud console is used to configure the cloud cluster. Let’s start by talking about how we can use the cloud console to configure the cloud cluster and edit settings such as: cluster size, security, number of users who have access to the cluster, and in which region is the cluster deployed.
Get Started:
- Upon logging in, we can immediately see the cluster region, cluster size, consumption details, and check or update the version for the cloud cluster which we have selected in the cloud console. The data centers are located in the US central region (Iowa) and US west region (Oregon).
Cluster Configurations:
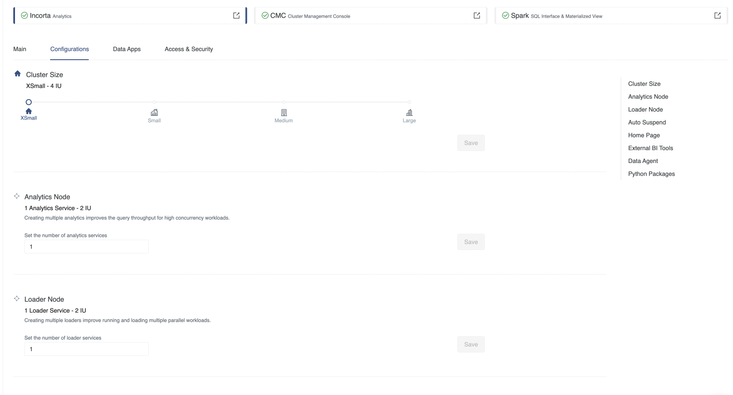
- Let’s start by going over the cluster sizes, loader, and analytics layer. Incorta’s cluster size is divided into multiple sizes. The xsmall cluster size has 13gb each for the loader and analytics memory while the large cluster has 110gb of memory for each node. We do have the option to scale all the way up to 5x or 10x cluster size with the memory of 3800gb each for loader and analytics. We can work with the Incorta team to select the appropriate size based on your data volume and needs. The loader nodes are used when data is being loaded into the Incorta cluster from the sources. The analytics nodes are used during the visualization layer. Allocation of the loader and analytics nodes are selected during the creation of the cluster and can be changed after the cluster creation under configuration settings. While loader and analytics nodes can have additional clusters added, the spark will autoscale.
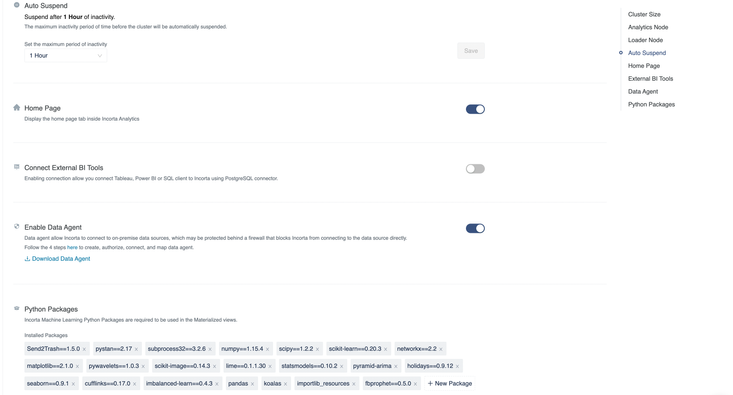
- Configuration settings can also be used to edit the auto suspend of the cluster for inactivity. The default is 1 hour but you can increase it to a time that best suits your use-case. Keep in mind, your cloud environment will stay awake if you have a scheduled schema load that runs every hour or more frequently.
- Furthermore, we can enable settings like connect to external BI tools using PostgreSQL. What this allows us to do is connect to third party applications for your visualization needs. Since Incorta is not a vendor lock, it complements other visualization tools such as Tableau, PowerBI, and etc. I would like to add that Incorta also has robust visualization capabilities.
- The last two options are about data agents and python packages. The data agent allows Incorta to connect with on-premise data sources which might be protected by a firewall. The python packages listed at the bottom of the page are pre-downloaded for use in the Materialized Views for some machine learning and data transformation needs.
Data Apps
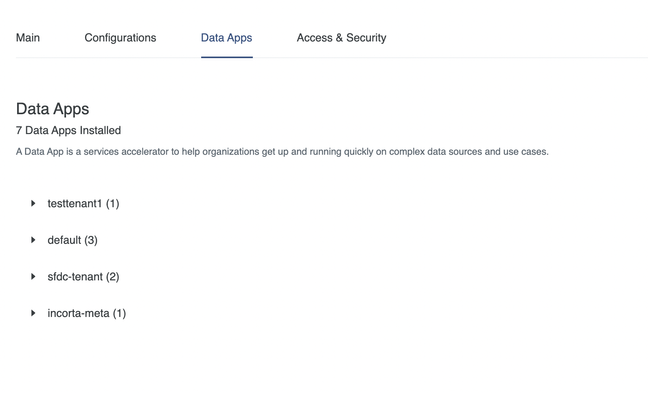
- The next tab is about Data Apps, where you will see how many Data Apps/ Blueprints are installed on your cluster. You can check which Data App(s) are installed on which instance under tenant name. For example, in the image below, we can see which Data App(s) are installed under each of the 4 tenant names available below.
Access & Security
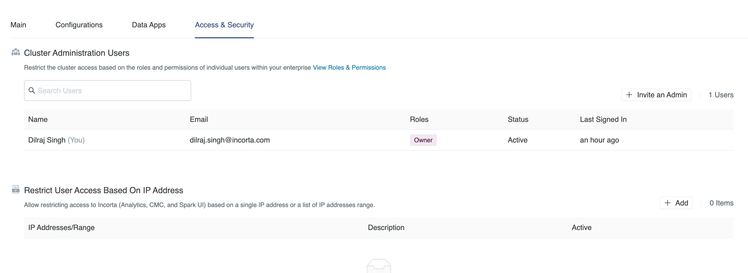
- Under Access and Security you can restrict the cluster access based on the roles permissions, and IP addresses. You can add users to the cluster as admins and you can see who currently owns the cluster.

