- Incorta Community
- Knowledge
- Administration Knowledgebase
- Using Templates with Excel Add-In
- Subscribe to RSS Feed
- Mark as New
- Mark as Read
- Bookmark
- Subscribe
- Printer Friendly Page
- Report Inappropriate Content
- Article History
- Subscribe to RSS Feed
- Mark as New
- Mark as Read
- Bookmark
- Subscribe
- Printer Friendly Page
- Report Inappropriate Content
on 08-15-2022 01:30 PM
Introduction
Microsoft Excel Add-in allows business users and analysts to do analytics on corporate data sources in a familiar Excel environment. This Add-in can be centrally managed and deployed and can allow users options for how they consume and present corporate data.
With the Incorta Excel Add-in, you can extract data from Incorta to Excel into a Table or Pivot Table. You can save a query for later use, and refresh the data when you reopen your spreadsheet. You can also use Excel built-in charts to create meaningful insights into your data.
In addition to interacting with the content in the workbook, Excel Add-ins can add custom ribbon buttons or menu commands, insert task panes, add custom functions, open dialog boxes, and even embed rich, web-based objects such as charts or interactive visualizations within a worksheet.
Let's Go
Example: Using Excel Add-In Financial Templates
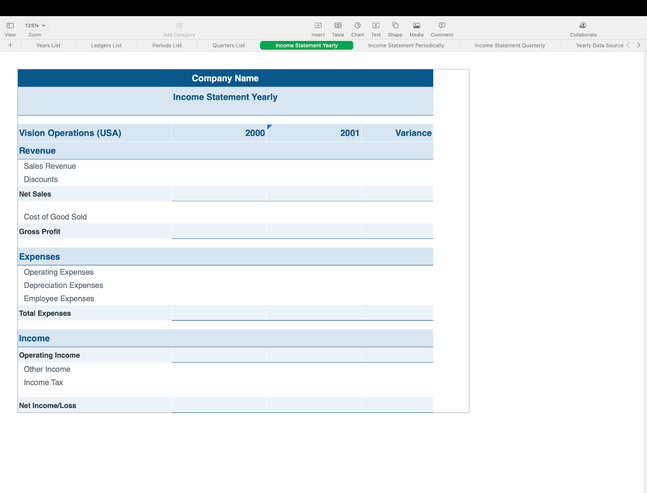
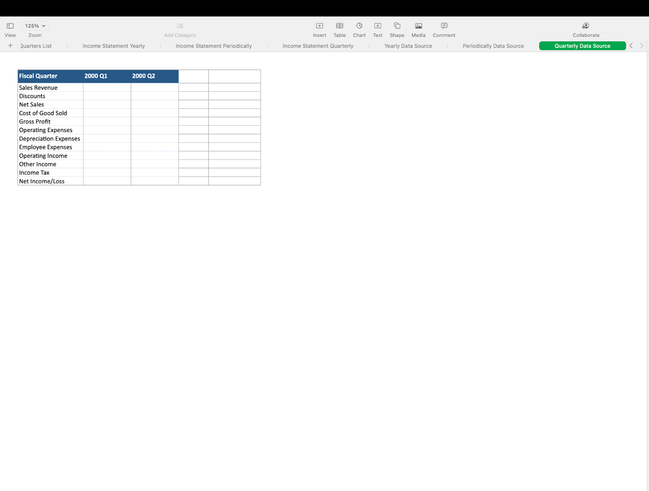
A great feature that exists in the Excel Add-in is Ready Made Templates.
Examples of these templates are financial templates such as:
- Yearly, periodically, and quarterly Income Statement templates.
- Yearly, periodically, and Quarterly data source templates.
Financial Templates provide all enterprise’s Accounts mapping and classification, e.g. operating expenses and its sub details.
Benefits:
Finance users and analysts like to use Excel with their own formulas, e.g. common size vertical analysis and horizontal analysis…
The Template can be ready, just by creating 2 new columns “vertical analysis” and “horizontal analysis” and then adding your own formula.
Finance people typically have their own Excel sheets with already built formulas as well. The faster and easier way is to use the Excel Add-in for quick mapping, leveraging previously built logic.
Another benefit of using the Excel Add-in is that after using a template and doing all of the required mapping, all the excel content can be imported from Incorta to have both UI dashboard and excel visualization and also another datasource in Incorta to build any other analysis later. Data can also be easily refreshed as needed.
Related Material
- https://docs.microsoft.com/en-us/office/dev/add-ins/excel/excel-add-ins-overview
- https://docs.incorta.com/5.2/integrations-microsoft-excel-add-in
- https://docs.incorta.com/cloud/integrations-microsoft-excel-add-in


