- Incorta Community
- Knowledge
- Data & Schemas Knowledgebase
- Customize Incorta Data Profiler
- Subscribe to RSS Feed
- Mark as New
- Mark as Read
- Bookmark
- Subscribe
- Printer Friendly Page
- Report Inappropriate Content
- Article History
- Subscribe to RSS Feed
- Mark as New
- Mark as Read
- Bookmark
- Subscribe
- Printer Friendly Page
- Report Inappropriate Content
on 08-30-2022 10:39 AM
- Introduction
- Calling DataProfiler API
- Basic Table Info
- Summary Table
- Correlation Table
- Frequency Table
- Histogram Table
- Incremental Load
- Related Materials
Introduction
This article will show you how to adjust the output of the Incorta data profiler with different parameters.
Incorta Profiler includes five materialized views. Each of them calls a different API that extracts or summarizes the data. You can call the APIs with different options. We will go over them one by one.
- table_info
- summary_table
- correlation_table
- freq_item
- histogram
Calling DataProfiler API
Basic Table Info
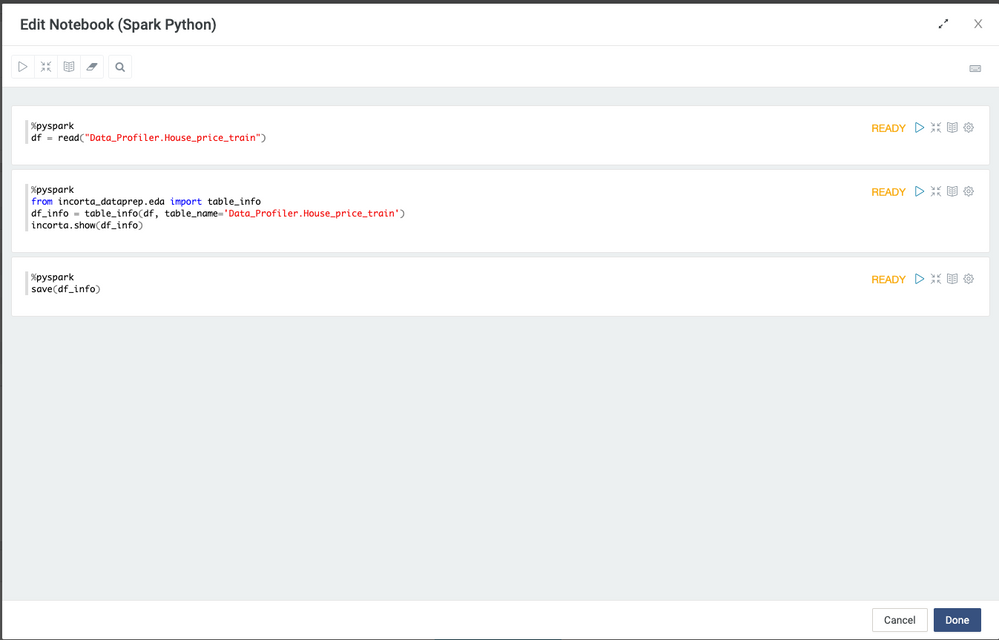
This MV shows the basic information about the table structure.
The output columns:
['table_name', 'NUM_OF_ROWS', 'NUM_OF_COLUMNS', 'NUM_OF_DUPLICATES', 'NUM_OF_NUMERICAL_COLUMNS', 'NUM_OF_CATEGORICAL_COLUMNS', 'NUM_OF_DATETIME_COLUMNS']
In table_info MV, we called the table_info() function
Require parameters:
- input_df: data frame
- table_name: the table name will be shown in the Data Profiler dashboard as a mandatory filter
Optional parameters:
- column_list: provide a list of columns name to filter the output.
Summary Table
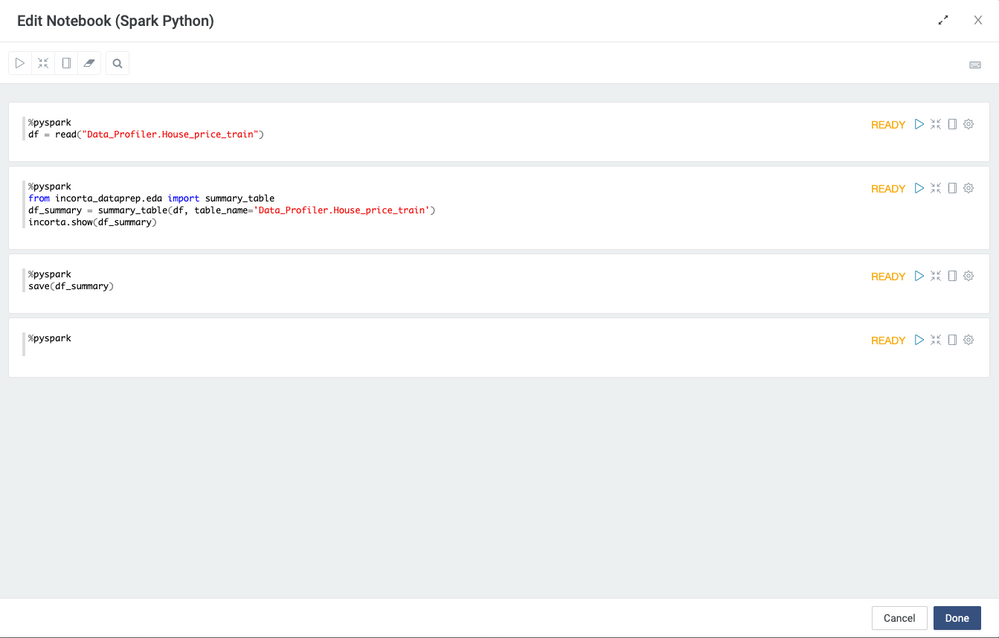
This MV calculates descriptive statistics and summary statistics of an entire data frame.
The output columns:
[‘table_name’, ‘column_name’, ‘count’, ‘mean’, ‘stddev’, ‘min’, ‘p25’, ‘p50’, ‘p75’, ‘max’, ‘missing_count’, ‘missing_pct’, ‘unique_count’, ‘unique_pct’, ‘dtype’, ‘variance’, ‘zero_count’, ‘zero_pct’, ‘kurt’, ‘skew’, ‘min_length’, ‘max_length’, ‘IQR’, ‘range’]
- count: count the number of rows with not null value
- stddev: standard deviation, a measure of the amount of variation or dispersion of a set of values
- p25, p50, p75: the 25%, 50%, and 75% quartiles. 50% quartile is the same as median.
- missing_count: number of rows with null value for the column
- unique_count: number of distinct values
- zero_count: number of rows with the value zero in the column
- min_length: the minimum length as the number of digits
- max_length: the maximum length as number of digits
- variance: a measure of how data points differ from the mean
- zero_count: the number of zero values
- kurt: kurtosis, a measure of whether the data are heavy-tailed or light-tailed relative to a normal distribution.
- skew: skewness, a measure of the asymmetry of a distribution
- IQR: interquartile range, IQR = 75 percentile - 25 percentile
- range: maximum-minimum
In summary_table table, we called summary_table function
Require parameters:
- input_df: data frame
- table_name: the table name will be shown in the Data Profiler dashboard as a mandatory filter
Optional parameters:
- percentiles: provide a list of percentiles specified as a percentage (eg, 5%, 10%, etc)
- column_list: provide a list of columns name to filter the output
Correlation Table
This MV shows each numeric column with the other numeric column's correlation.
The output columns:
['table_name', 'Feature1', 'Feature2', 'Correlation']
- Feature1: the column name 1
- Feature2: the column name 2
- Correlation: the correlation between column name 1 and column name 2
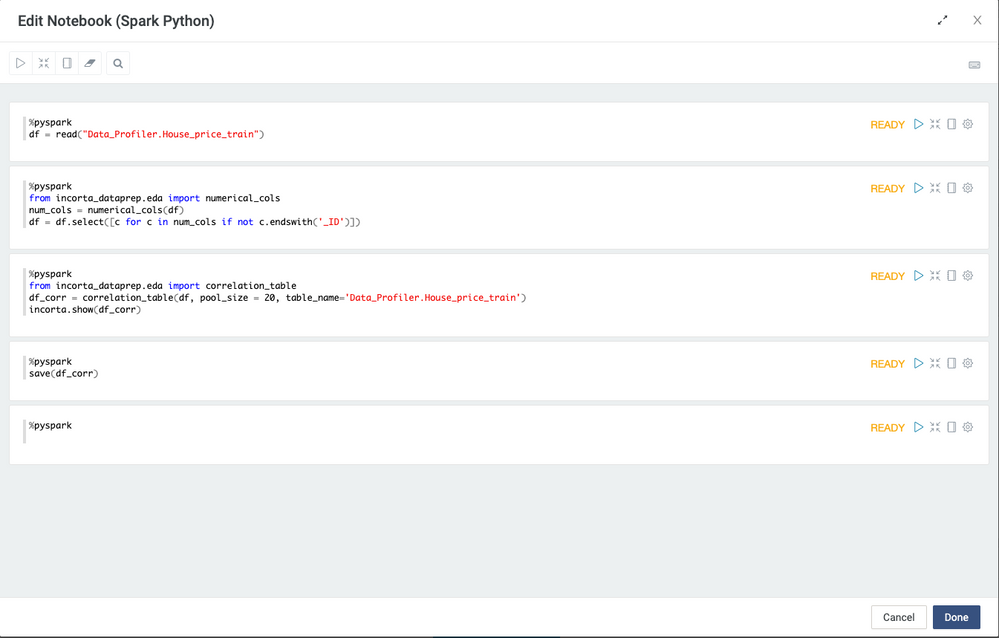
In correlation_table table, we called numerical_cols and correlation_table functions. Only the columns with the numerical data types will be used.
numerical_cols function
Parameter:
- input_df: data frame
You can review the columns that will be used and further remove the unwanted columns from the list.
correlation_table function
Require parameters:
- input_df: data frame
- table_name: the table name will be shown in the Data Profiler dashboard as a mandatory filter
Optional parameters:
- pool_size: a thread pool maintains multiple threads for concurrent execution, pool size default is 10, can only between 1-40. If you have a large data set and have multiple cores, you can adjust this parameter to a larger value.
- column_list: provide a list of columns name to filter the output
Frequency Table
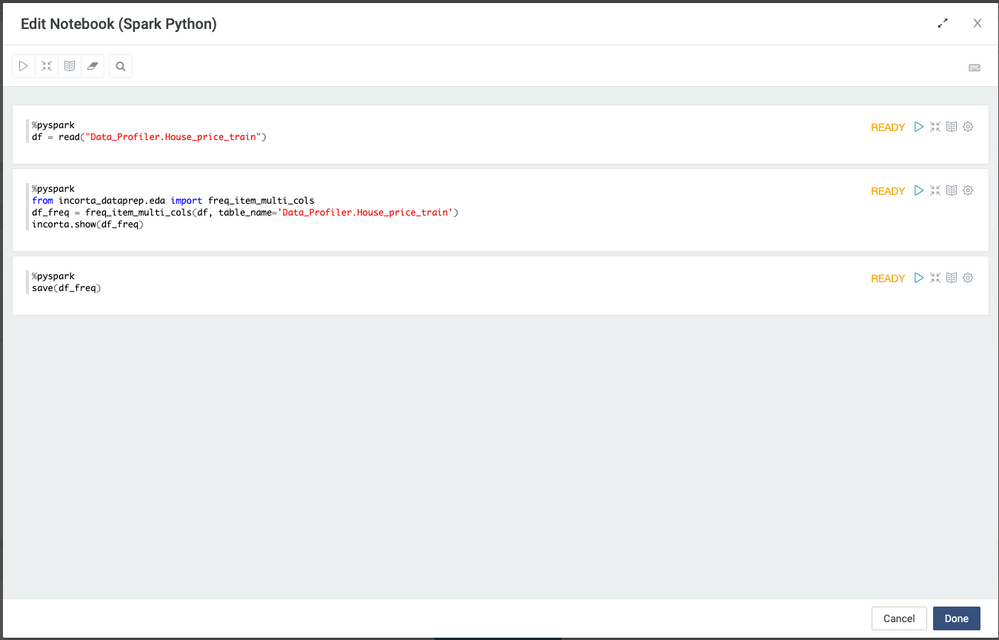
This MV shows the frequency of each value in a column.
The output columns:
['table_name', 'column_name', 'value', 'row_count', 'freq_pct']
- value: a column value
- row_count: the number of rows with the value
- freq_pct: percentage of the rows with the the value over the total number of rows
In freq_item table, we called freq_item_multi_cols function
Require parameters:
- input_df: data frame
- table_name: the table name will be shown in the Data Profiler dashboard as a mandatory filter
Optional parameters:
- limit: Limit the number of the values shown in the output. The values are sorted by the frequency and the values with low frequency are dropped. The limit default is 50, and can be between 1-500
- column_list: provide a list of columns name to filter the output
Histogram Table
This MV shows the value distribution of columns. You can go through the histogram table to see the row count for each range of values.
The output columns:
['table_name', 'column_name', 'bucket', 'row_count']
- bucket: bucket value(10 buckets total) is for defining the range of values
- row_count: the number of rows that is within the range
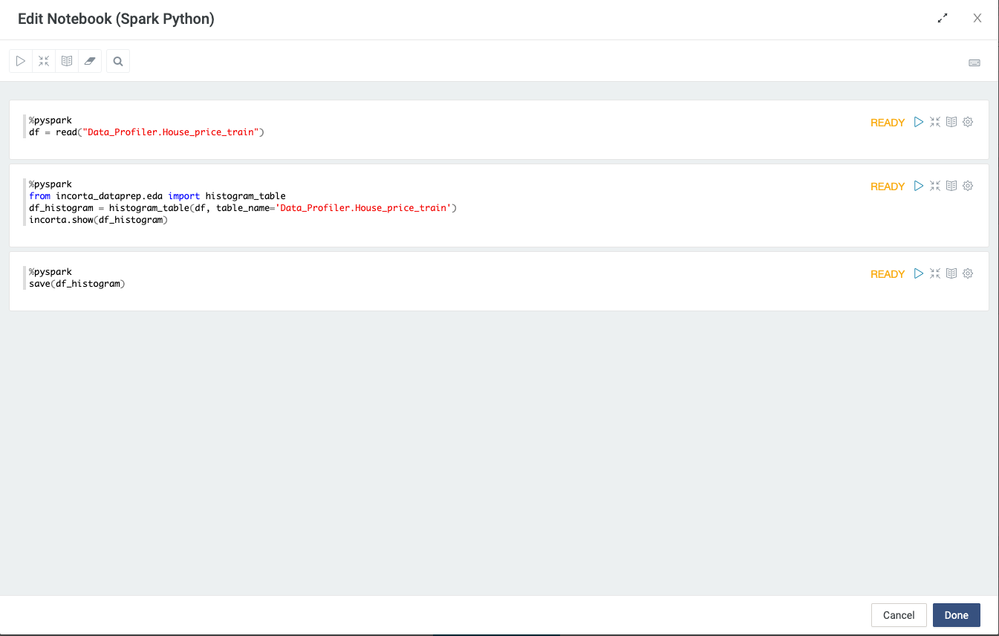
In the histogram table, we called the histogram_table function
Require parameters:
- input_df: data frame
- table_name: the table name will be shown in the Data Profiler dashboard as a mandatory filter
Optional parameters:
- column_list: provide a list of columns name to filter the output
Incremental Load
Multiple Datasets
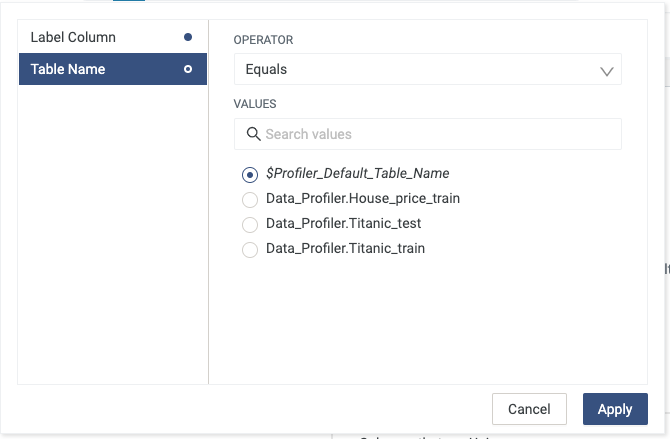
Incorta Profiler let you to add multiple tables and switch between them if you have multiple tables.
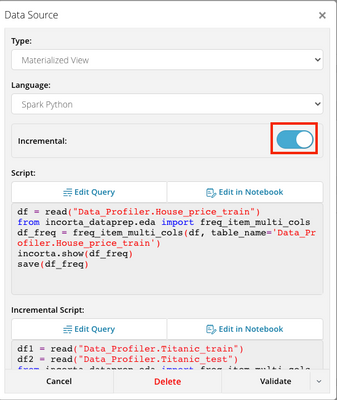
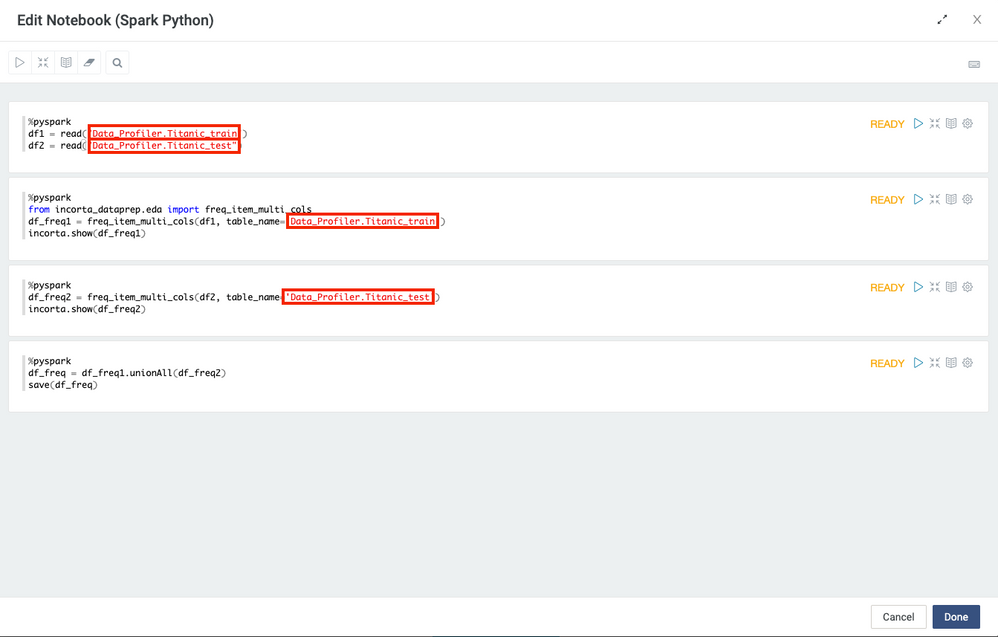
In your schema, enable Incremental, and add your tables to your scripts. Call the DataPrepAPI for each table and use unionAll to combine the results into the same MV.
For example, replace the highlight sample codes following by format [SCHEMANAME].[TABLENAME], using the union all to save the data frame.
Go to your Dashboard, and you can choose your the table you would like to explore.
Related Materials
- Mark as Read
- Mark as New
- Bookmark
- Permalink
- Report Inappropriate Content
This is great @suxinji !! Thanks for sharing the knowledge!
