- Incorta Community
- Knowledge
- Administration Knowledgebase
- Troubleshooting High CPU issues
- Subscribe to RSS Feed
- Mark as New
- Mark as Read
- Bookmark
- Subscribe
- Printer Friendly Page
- Report Inappropriate Content
- Article History
- Subscribe to RSS Feed
- Mark as New
- Mark as Read
- Bookmark
- Subscribe
- Printer Friendly Page
- Report Inappropriate Content
on 03-24-2023 06:46 AM
Introduction
The article below will walk you through steps for troubleshooting and diagnosing high-consumption CPU issues on UNIX servers hosting Incorta / Spark. The article will be divided into four sections:
- How to identify high CPU usage
- How to find the process causing the high CPU
- How to find the thread within the process causing the problem, and
- Finding the thread name.
Part 1: How to Identify High CPU Usage
Using top command
-
Top is an interactive unix tool that is used to show OS metrics. It can be interactively executed at the time of the issue.
-
Id (highlighted in snapshot below) represents the idle percentage for the total CPU. The higher the CPU, the closer the idle % will be to zero.
-
Total processing power will be the number of cores * 100. For example, a machine with 16 cores can be up to 1600%.
-
In the top command, if you see a process consuming 200% or 300% (above 100%). This is not considered a high CPU utilization unless all cores are considered.
Use the following table as a guide to using the top command.
| P | sort all running processes by CPU usage |
| S | sort all processes by how long the processes have been running |
| I | hide all idle processes |
| M | sort all running processes by Memory usage |
2. Monitoring Systems:
-
Several 3rd party monitoring systems can be configured to monitor Incorta Servers OS metrics to detect usage anomalies.
-
For example, the below snapshot is taken from WatchDog; used to monitor the CPU for an Incorta Server. You can recognize the high CPU peak highlighted below.
3. OS SAR (System Analysis Reports):
-
Unix provides system analysis reports located under var/log/sar. The files will help to check the OS's performance metrics. With some other third-party tools, these files can be graphed to show these metrics in a visual format.
- Check your OS manual; sometimes SAR is not enabled by default.
- SAR reports are available in text and binary format (sa→ binary, sar→ text). Files are rotated at the end of the day from the binary to text format. Also, ad-hoc conversion can be done using UNIX commands.
Part 2: Which Process is causing the high CPU?
Now that we have identified a CPU issue, we want to drill down further to the process causing the issue. In some cases, Incorta is not only the only software installed on a server; we also can find Spark, MetaDBs, etc.
Running OS commands at the time of the issue is a challenging way to diagnose such problems due to complications executing these commands themselves. Servers may not be accessible during high CPU incidents, or the issue has been resolved before we can diagnose it.
OS commands can be registered on the crontab script to check which process is causing the problem.
1. ps commands
Ps is often the most effective method since ps gives you a wide range of info on the process running. Unlike the top command, it prints the whole command being executed.
The below command is used to print out the 6 highest CPU-consuming processes. Note that this can command can differ from one UNIX distribution to another.
ps -Ao user, uid, pid, pcpu, TTY, args --sort=-pcpu | head -n 6
Part 3: Which thread is causing the high CPU for the process?
top command:
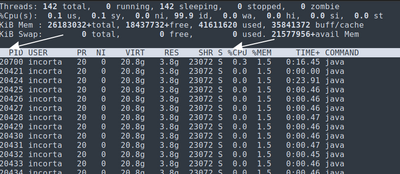
Let's revisit the top command once more. However, this time, run it is a script instead of interactively. The output will be spooled to a file.
The below command will print the threads running for a process. This will be executed for the highest CPU process from the previous ps command.
top -H -p 20421

top -H -p 20421 -b -n1 (non interactive)

top -H -p 20421 -b -n1 > threads.log ( Output will be redirected to threads.log)
The results will show pid (thread id) and the CPU percentage for this specific thread.
Part 4: What is the thread name?
After following the above steps, you should have:
1) What process causing high CPU consumption
2) What thread within the process is causing high CPU consumption
The next step is to find out the thread name, so I can have more insight into which component is causing the slowness in the application.
1. Capture jstack for the process with high CPU ( from part 3). E.G. jstack 20421
2. Convert the problematic thread to hexadecimal (From part IV). I will assume here that it is 20700 → 0x50DC.
3. Check the relevant thread in the thread dump. Be aware of case sensitivity in your search. Letters in the thread dump are lowercase.
[incorta@0518de8190a9 ~]$ jstack 20421 | grep -i "0x50DC"

"Tomcat JDBC Pool Cleaner[875016237:1676374929579]" #34 daemon prio=5 os_prio=0 tid=0x00007f3be5c6b800 nid=0x50dc in Object.wait() [0x00007f3afc8ee000]

[incorta@0518de8190a9 ~]$
Conclusion
Using these steps, you can quickly and efficiently investigate the issue. The Incorta Engineering team will help you further by using all the information you provided through this investigation.
As a future consideration, automation can be done to collect all of the above info regularly. Just remember that your script's run intervals will be run in a shorter time window than the period of the issue in which the high CPU consumption happens.


