- Incorta Community
- Knowledge
- Dashboards & Analytics Knowledgebase
- How to Configure Predefined Values for Presentatio...
- Subscribe to RSS Feed
- Mark as New
- Mark as Read
- Bookmark
- Subscribe
- Printer Friendly Page
- Report Inappropriate Content
- Article History
- Subscribe to RSS Feed
- Mark as New
- Mark as Read
- Bookmark
- Subscribe
- Printer Friendly Page
- Report Inappropriate Content
on 06-22-2022 05:15 AM
Introduction
We often use presentation variables to allow our users to customize dashboard insights allowing for self-service and flexibility. These variables can update filters, aggregation methods, formatting options and much more. It is common to provide our end users with predefined input options for a better user experience. We will demonstrate step-by-step how to configure a presentation variable with custom predefined values.
What you need to know before reading this article
Let's Go
Create a List of Values
First, add a list of values to a column of a new spreadsheet in Excel or Google Sheets. Be sure the column has a field name. Below is an example of the table we will use.
| Date Filter |
| Previous Day |
| Previous 30 Days |
| Previous 90 Days |
| None |
Load the Spreadsheet to a Schema
Next, add the spreadsheet as a new data file in Incorta. We will add this file to a schema as a new table. This can be an existing schema or a brand new one. The screenshot below shows my file pv_Options.xlsx loaded to a new schema.
Once the table is loaded, we will share it with any user groups that require access.
Apply the Field to Your Presentation Variable
Now, we will configure our presentation variable to use the list of values as predefined options for our end user to select.
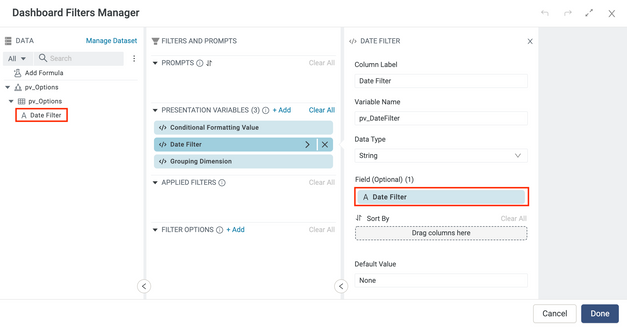
In the Manage Filters & Prompts menu of your dashboard. Add a presentation variable, configure the display name, variable name, data type, and default value.
Finally, add the table we created in the previous step to our available tables menu, drag and drop the custom field to the Field (optional) section, and select Done.
View Results
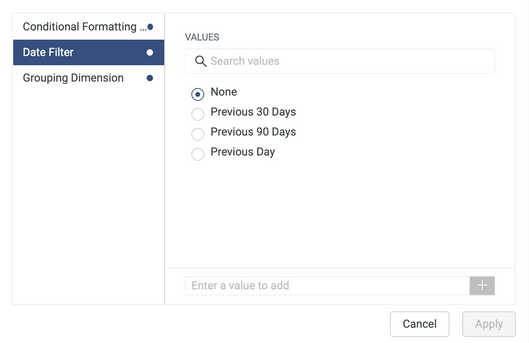
Save the changes to your dashboard filters and prompts and navigate back to the dashboard to see your predefined values presented to your user as options.


