This website uses Cookies. Click Accept to agree to our website's cookie use as described in our Privacy Policy. Click Preferences to customize your cookie settings.
Turn on suggestions
Auto-suggest helps you quickly narrow down your search results by suggesting possible matches as you type.
Showing results for
- Incorta Community
- Product
- Product Ideas
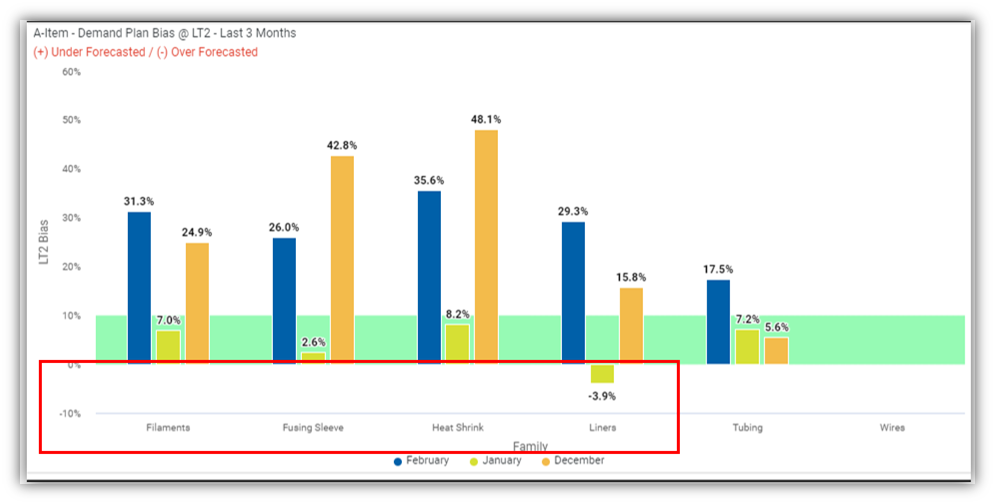
- Plot Bands ONLY Positive values, why?
Options
- Subscribe to RSS Feed
- Mark as New
- Mark as Read
- Bookmark
- Subscribe
- Printer Friendly Page
- Report Inappropriate Content
cbossong
Ranger
Options
- Subscribe to RSS Feed
- Mark as New
- Mark as Read
- Bookmark
- Subscribe
- Printer Friendly Page
- Report Inappropriate Content
03-14-2024
10:05 AM
Status:
New
You must be a registered user to add a comment. If you've already registered, sign in. Otherwise, register and sign in.
Recently Completed Ideas
