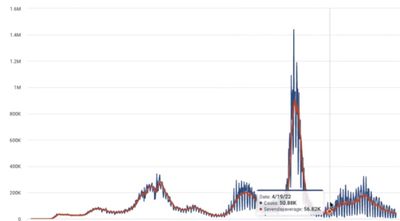
Calculating Moving Averages
This article will discuss moving averages, their benefits, drawbacks, and how to employ them in your data!
This article will discuss moving averages, their benefits, drawbacks, and how to employ them in your data!
Introduction Incorta can help map your custom map shapes to your transactional systems that drive your business. What you need to know before reading this article Have a KML or KMZ file ready to be imported. If you are new to KML/KMZ creation and wa...

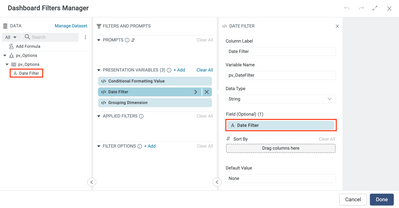
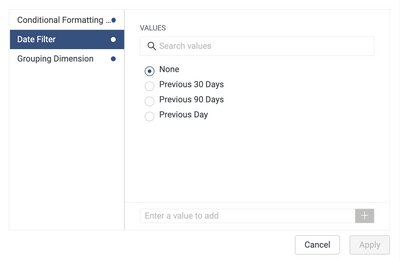
Presentation variables allow dashboard viewers to customize their visualizations on the fly. Dashboard developers can guide their viewers with predefined input options. Follow this guide to steer users in the right direction as they self-serve.
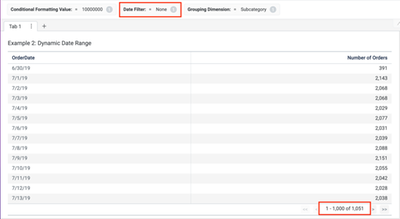
Introduction A frequent request in the BI world is comparing a metric over time. Has this metric improved, worsened, or stayed the same in the last week, month, or year? This article explains how Incorta handles these Time Intelligence scenarios. W...

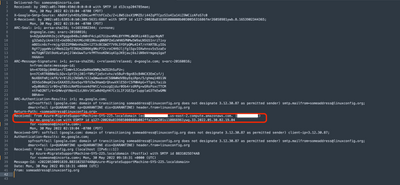
Question How to find out which instance is sending me the dashboards ? This can happen in case users are receiving emails from unknown source that are not scheduled. (i.e Importing tenants on other servers without suspending the schedule) Answer I...
This article presents some ideas for how to best take advantage of what the Advanced Map visualization has to offer.

Pivot tables are no stranger to the world of BI. In this article, we make some recommendations and key considerations for when you build your next pivot tables.

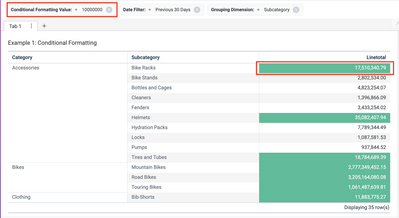
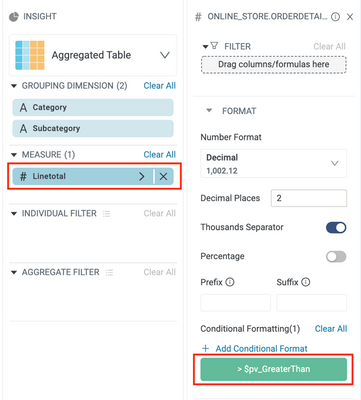
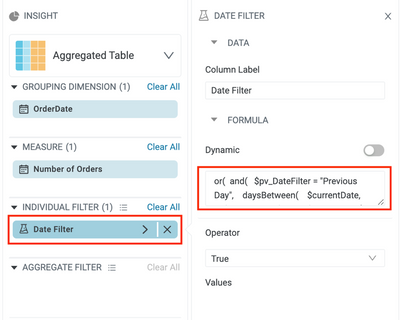
When a user sets a presentation variable, the value is stored in a named variable. Until that named variable is referenced somewhere in the dashboard, the user will not see any changes to their view. Let’s explore three ways to utilize presentation variables.
Changing the colors of dashboards and insights can add extra flair and alignment to your brand and business. This article will explore how you can change colors on your dashboard and insights.

Quickly left or right pad your fields using this formula.
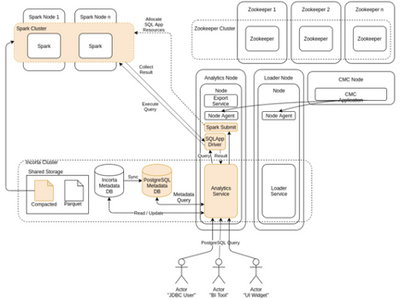
The Incorta SQL Interface, known as SQLi, is an integral part of Incorta that allows external clients to connect and integrate with the Incorta data platform. External BI tools like Power BI, Tableau, and Microstrategy can harness the data in incorta with the PostgreSQL JDBC connector and with the speed of Incorta Direct Data Mapping and Spark.
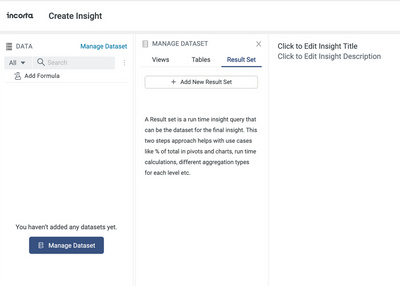
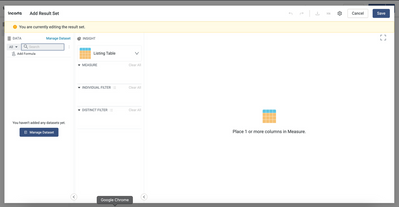
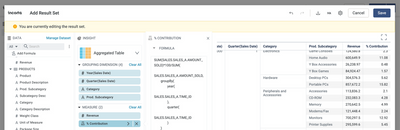
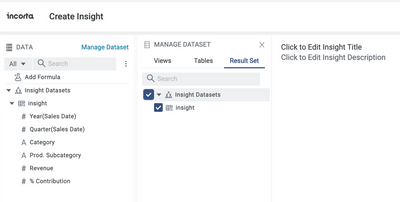
A key area of product focus at Incorta is to provide powerful analytical capabilities while retaining the simplicity of creating insights on a dashboard. The Insight over Result set is one such feature designed to empower business users to leverage...
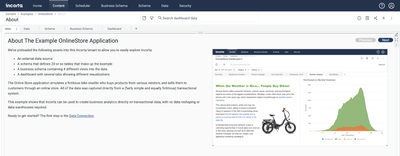
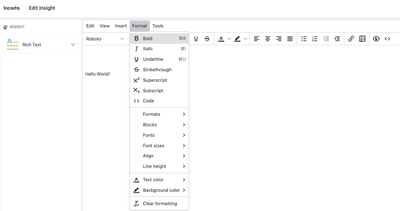
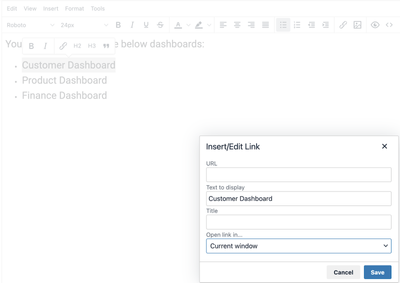
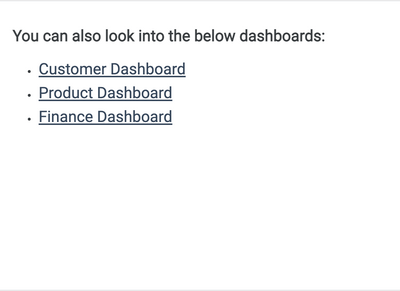
Introduction The Rich Text Insight is a new Incorta insight that enables users to add rich text content to their dashboards. The rich text visualization gives you access to a What-You-See-Is-What-You-Get (WYSIWYG) text editor. Incorta stores the rich...