Currency Conversion Use Cases
This article discusses various currency conversion use cases and how to implement them in Incorta.

This article discusses various currency conversion use cases and how to implement them in Incorta.
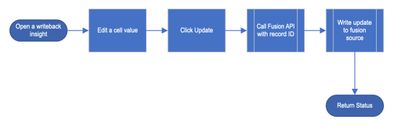
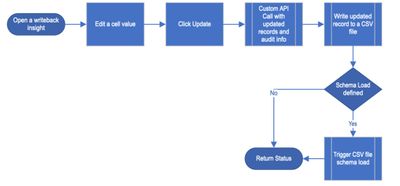
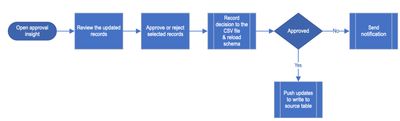
Ever wanted to do minor status updates on records loaded to Incorta?! Wanted to key in values and push back to a destination or to the source system?! Component SDK allows you to build your own write back component!
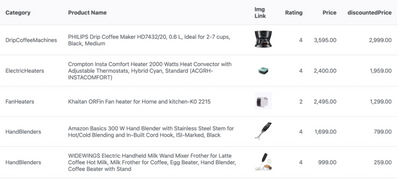
Introduction The visual table is a new SDK component available from Incorta Marketplace. It is a tabular view of your data with the ability to add images. The allowed image types are jpg, png, JPG, and PNG. With multiple dimensions and measures, t...
Use the Playlist feature to put impactful Incorta dashboards on display.
Learn how to reuse business logic instead of recreating it.

Setting up contextual report delivery can save you and your stakeholders time and effort!

Learn all about how you can take your dashboards to the next level with the free form layout.

With Incorta, it's possible to embed custom parameterized links within an application to drill-down or drill-back into your data. Take Blackline for example. In Blackline, when doing reconciliation and more detail is needed, instead of going back...

This article discusses the best practices of using a line chart to visualize data in Incorta.

Introduction When using a tag (word) cloud, you may find a whole text field being applied to the insight. That may be useful in some cases if the text fields contain one or two words, but extra preparation could be required when working with longer-f...