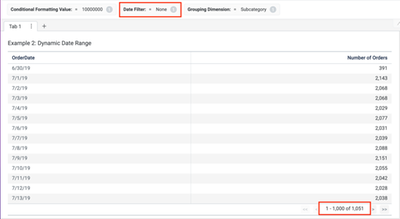
Pivot Tables
Pivot tables are no stranger to the world of BI. In this article, we make some recommendations and key considerations for when you build your next pivot tables.

Pivot tables are no stranger to the world of BI. In this article, we make some recommendations and key considerations for when you build your next pivot tables.
When a user sets a presentation variable, the value is stored in a named variable. Until that named variable is referenced somewhere in the dashboard, the user will not see any changes to their view. Let’s explore three ways to utilize presentation variables.
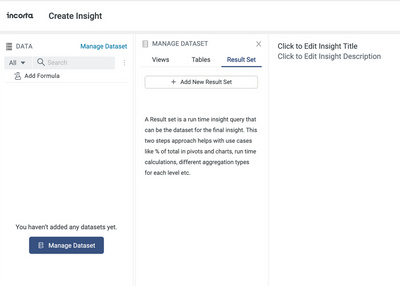
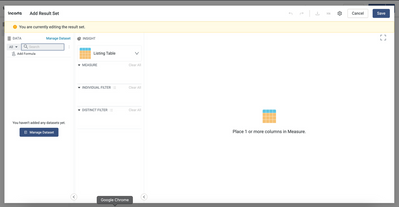
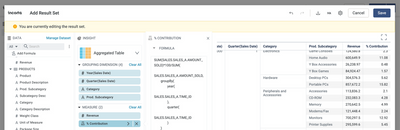
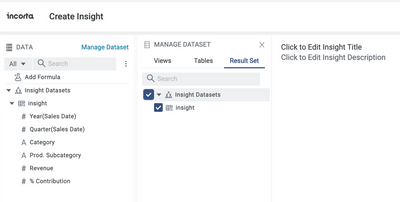
A key area of product focus at Incorta is to provide powerful analytical capabilities while retaining the simplicity of creating insights on a dashboard. The Insight over Result set is one such feature designed to empower business users to leverage...
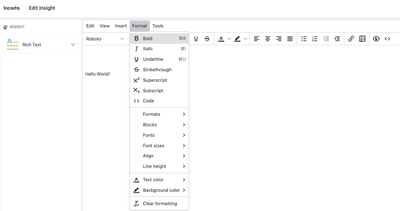
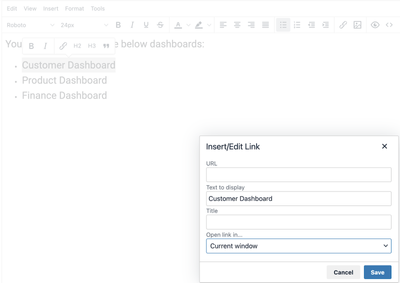
Introduction The Rich Text Insight is a new Incorta insight that enables users to add rich text content to their dashboards. The rich text visualization gives you access to a What-You-See-Is-What-You-Get (WYSIWYG) text editor. Incorta stores the rich...
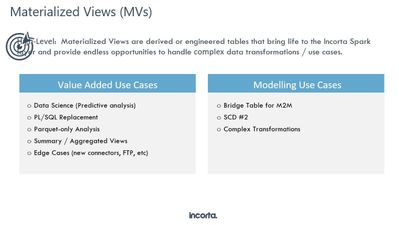
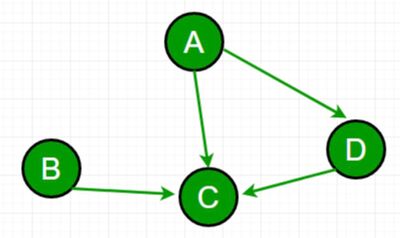
Incorta allows you to create Materialized Views using Python and Spark SQL to read the data from the Parquet files of existing Incorta Tables, transform it and persist the data so that it can be used in Dashboards. We can leverage the power ...
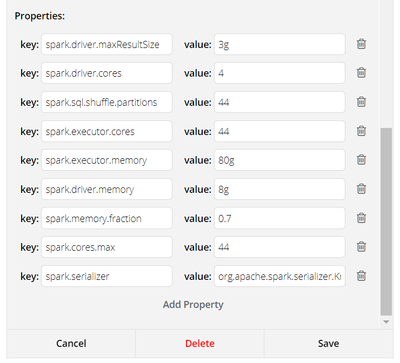
Many of Incorta's customers choose to power their Tableau dashboards with Incorta's extremely performant data platform. To maximize performance and avoid as many configuration headaches as possible, there are a few best practices that should always be followed that are outlined below:

Build PowerBI dashboards on top of Incorta

Introduction You can take advantage of the Incorta SQL Interface (SQLi) to access data from your Incorta tenants using the PostgresSQL protocol. What this allows you to do is build dashboards using data stored in Incorta in third party visualization...

Introduction This article looks at the advantages of Visual Analytics and discusses best practices when looking at data in Incorta. What you should know before reading this article We recommend that you be familiar with these Incorta concepts before ...

IntroductionIncorta provides the ability to a la carte export and import individual objects both through the Incorta UI and the Incorta Command Line Interface (CLI). Because any individual dashboard may rely on several supporting objects including se...
Introduction Incorta provides many enhancements that help users get the most out of presenting visualizations. This article covers the features that allow users to select which table column is the Group By and which column is the Measure in an Aggre...

Introduction At times it may be helpful for the consumers of reports and dashboards to know when the data was refreshed. This article will walk you through the process of adding that information to an insight within Incorta. What you should know befo...

Dashboards are the only part of Incorta that many of your users will interact with and as such, you want the dashboards to provide a good experience for them. This article focuses on the design elements that will make your dashboards hum.